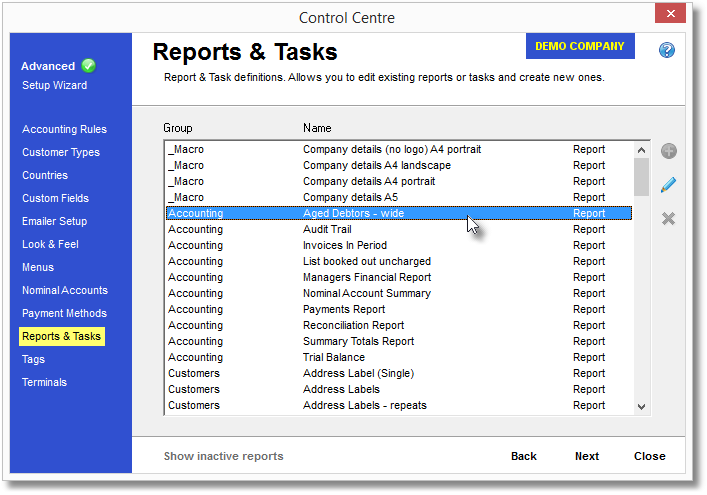
How to get here
Tools menu > Control Centre > Advanced > Reports & Tasks.
From this page you can view and make modifications to all the reports and tasks within Lab Manager.
The current user will need to have Advanced control level to access this page
![]() Edit a Report or Task
Edit a Report or Task
Either double-click on a report to bring up the Edit window, or highlight the report in the list then click the blue pencil icon.
Users are restricted in what they can edit on a report, to preserve important settings.
Once you open a report for editing, you will be presented with the window below. This example is for the Statement (monthly):
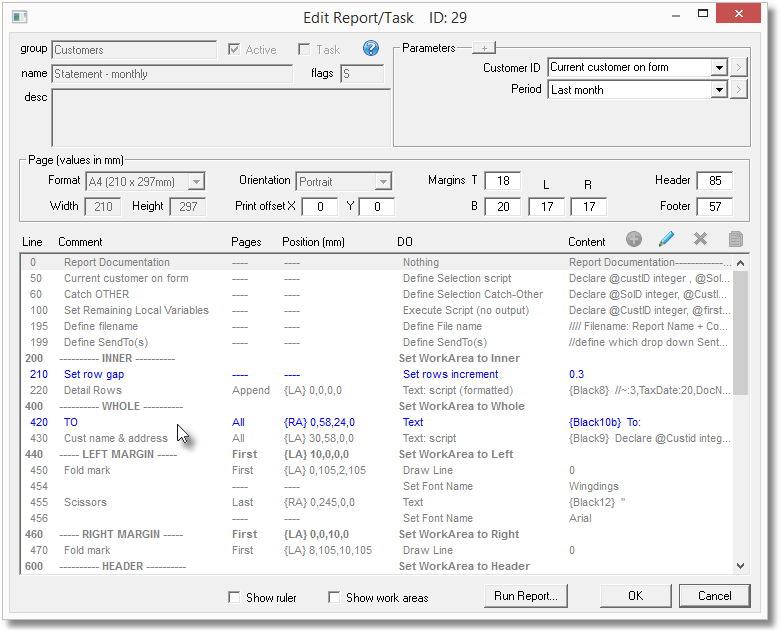
Items which are greyed-out, such as the Page Format or Add and Delete buttons, can only be accessed by a Transactor support technician.
The large white box in the lower half of the window lists all the commands that produce the report. Most of the lines will be GREY to indicate you cannot make any changes to them.
Lines in BLUE can be edited by the user, although you may need to contact Transactor support for help with some of these.
Lines in LIGHT BLUE can be edited by the user, but are currently inactive. You will need to tick the "Active" box when editing the line to enable it.
After making any changes, you can test the report by clicking the "Run Report" button at the bottom of the window. Be aware, however, that some reports will require a job or customer to be present on the Main Form in order to show any results.
User modifiable controls on the Edit Report/Task window:
Note, you would normally not need to make any changes to these settings as they will have been configured appropriately from when you installed Lab Manager.
All measurements are in millimetres, so use a value of 10 to represent 1cm. You can tick the "Show Ruler" box to help you when you preview the report.
Control |
Explanation |
Parameters |
The default values for the information the user is expected to provide when running the report, such as for specifying a customer ID, or start and end dates.
|
Print Offset X and Y |
If your printer seems to cut off the edges of a report, or doesn't centralise it properly you could try changing the Print Offset. X represents shifting the print more to the right, and Y represents shifting the print further down the page.
You can use negative numbers to represent a left shift or up shift, rather than right or down. (eg. use an X of -10 to shift the print 1cm to the left)
|
Margins T, B, L, R |
The blank area around the report that nothing should print in. The initials stand for Top, Bottom, Left and Right.
|
Header |
The vertical space at the top of the report reserved for the header information, which usually includes postal addresses, date range etc. The main body of the report will start after this space.
|
Footer |
The vertical space at the bottom of the report reserved for the footer information, which can include summary information or a tear-off slip. The main body of the report appears in the area above this space.
|
Blue Lines |
You may only edit blue lines in the main box of this window. Light blue lines indicate that line is Inactive. Grey lines are locked from editing except by a Transactor support technician.
To edit a blue line, either double-left click it with the mouse, or highlight then click the pencil icon above the list.
|
Show Ruler |
When you click the "Run Report" button, or otherwise send this report to a preview window, with this option ticked a vertical and horizontal ruler will appear to help you check distances and positions.
The ruler will not print out with the report, or be included in a PDF file. It will only show in the preview window.
|
Show Work Area |
When you click the "Run Report" button, or otherwise send this report to a preview window, with this option ticked you will see blue outlines representing the different areas of the report (such as header, footer). This will help you determine the size of these areas.
The work area lines will not print out with the report, or be included in a PDF file. They will only show in the preview window.
|